A public analytics product for the mortgage and real estate market
An interactive service that brings together mortgage market dynamics, interest rates, customer profiles and decline patterns in one interface. Nine months of analytics are publicly available, while the latest three-month snapshot is available to partners after registration.
Live since 1 June 2026
Role: Product research, UX logic, technical design, independent development, launch and ongoing support
Stack
- Next.js 14
- TypeScript
- Tailwind CSS
- Recharts
- Google Sheets API
- OpenRouter
- JWT
- Prisma
- PostgreSQL
- amoCRM
- Slack
- dashboard indicators
- 21dashboard indicators
- analytics sections
- 7analytics sections
- to the first working MVP
- 5 daysto the first working MVP
- from implementation start to public launch
- 2 weeksfrom implementation start to public launch
Context and challenge
Executives and specialists at real estate companies need regularly updated data to make decisions about sales, pricing, promotions and mortgage programmes.
Before the service launched, those figures were scattered across separate reports, commercial exports and external sources. To assess how rates were moving, how demand was structured or what customers looked like, specialists had to find, export and reconcile the data themselves.
That took time and made it hard to use analytics regularly as part of day-to-day work.
Who the product is for
- commercial and marketing directors at developers and real estate agencies
- heads of sales and mortgage divisions
- analysts and product teams
- mortgage brokers and specialists
- Sdelka.rf partners
Solution
The Sdelka.rf team decided to build a separate public product on top of the data accumulated by the platform and its partner analytics.
Instead of a set of disconnected reports, there is now a single interactive interface with one shared period selector. Nine months are open without registration, and access to the three most recent months is granted through a form. The data is updated monthly.
Key market metrics
The number and volume of mortgages issued, average loan size, average term, and a split between the new-build and secondary markets.
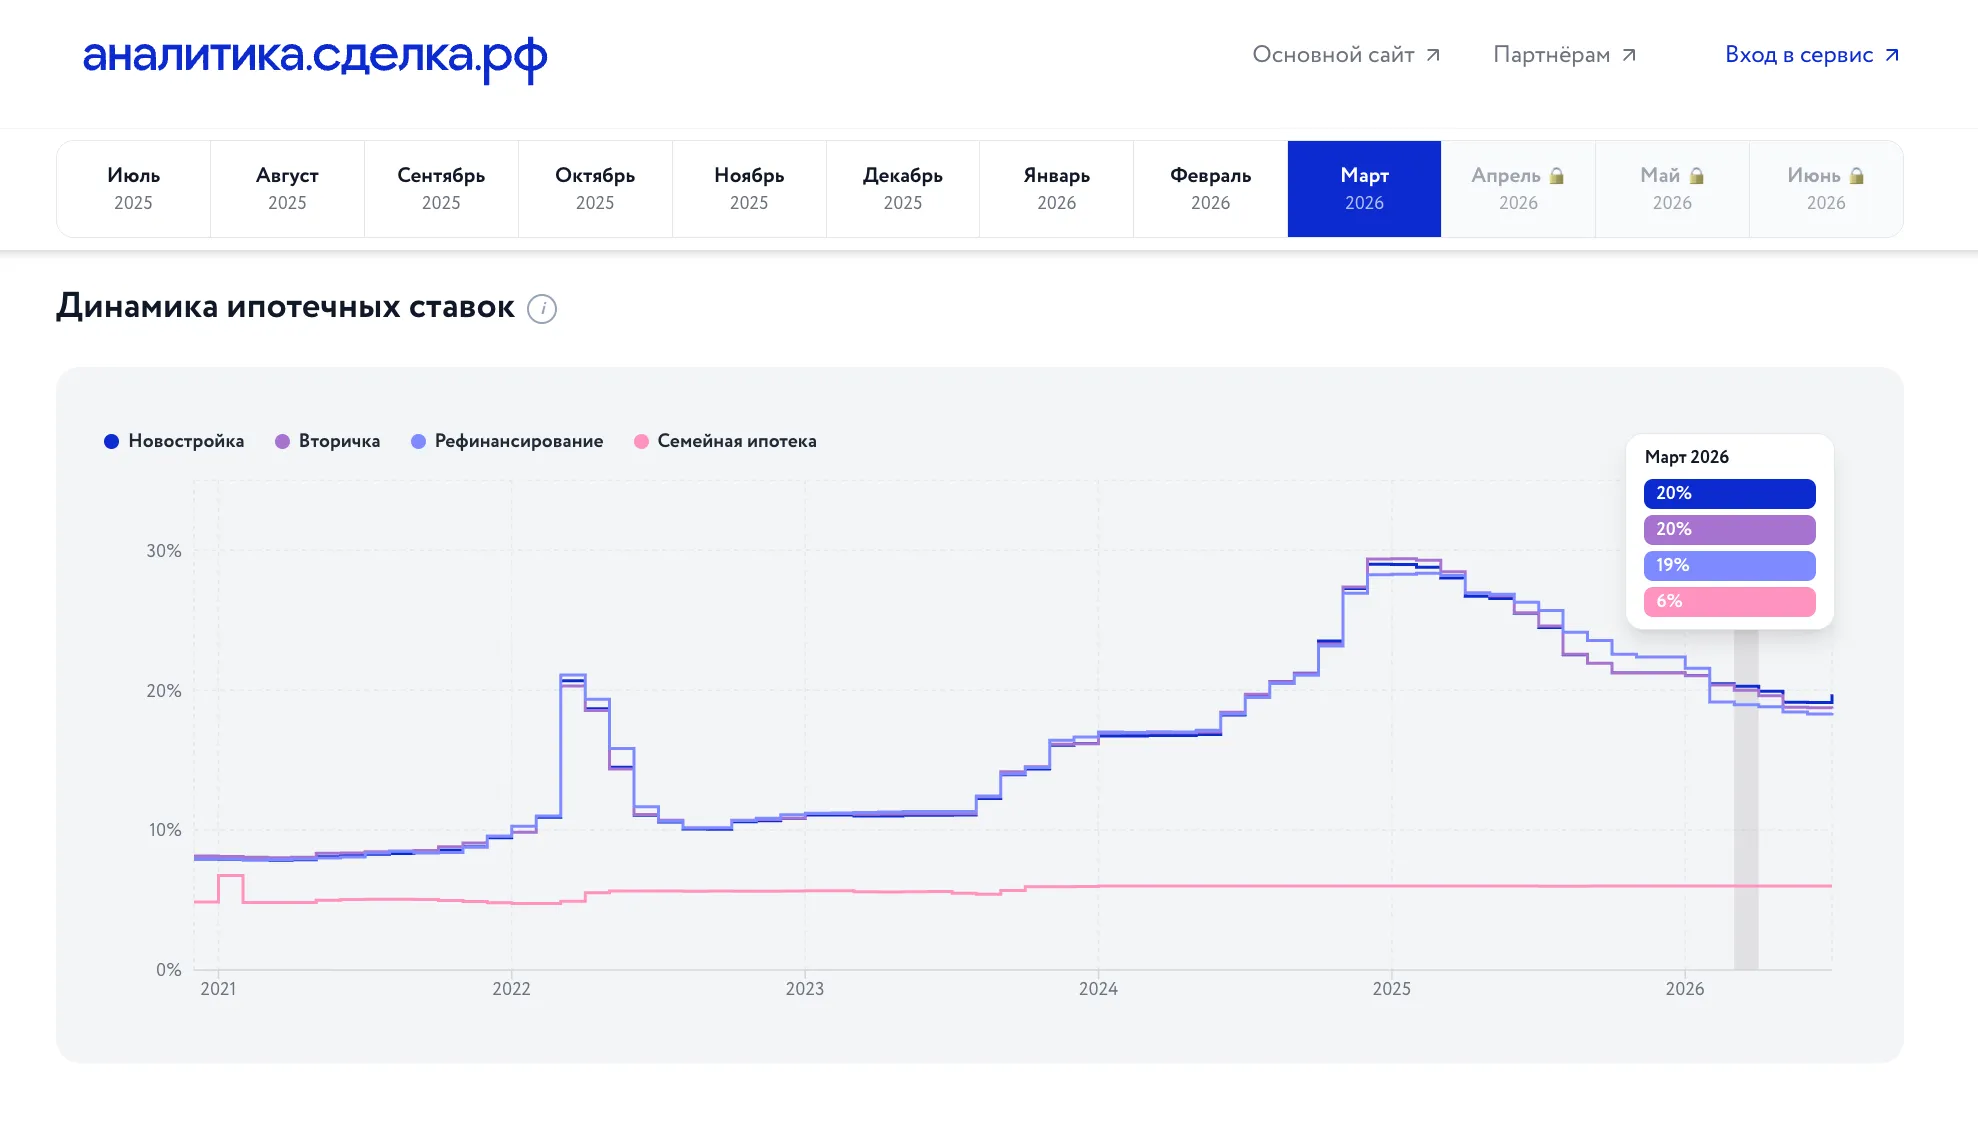
Mortgage rate dynamics
A historical series for new-build, secondary market, refinancing and family mortgage rates.
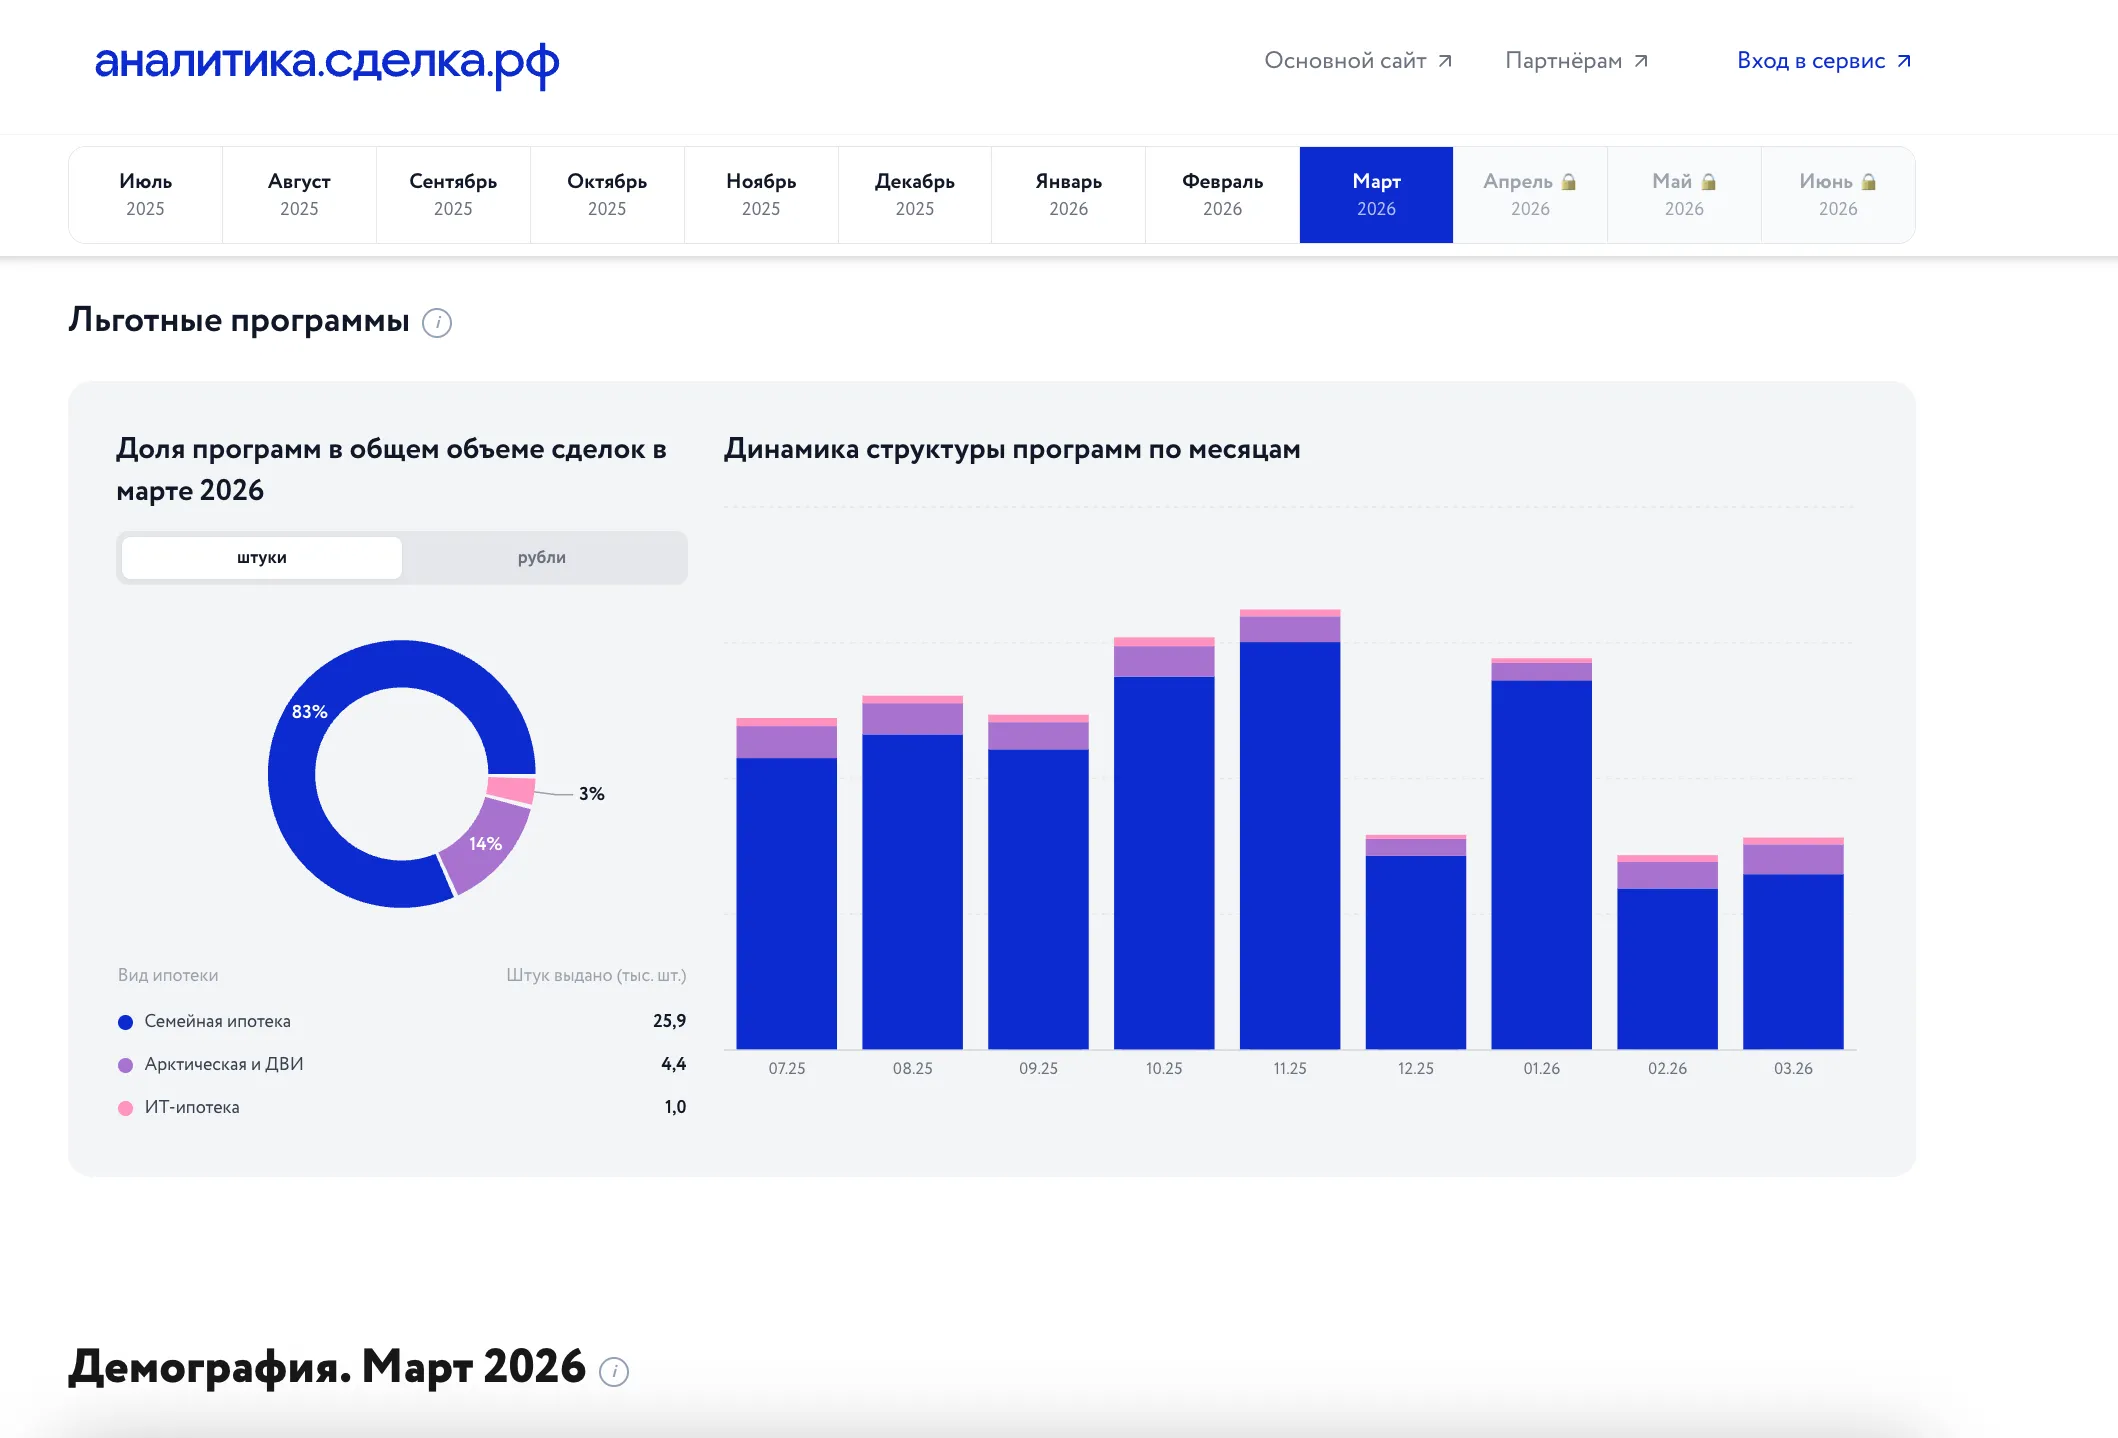
Subsidised programmes
The share of each programme in total lending and how the programme mix shifts month over month.
Demographic profile
Age, gender, marital status and other customer characteristics.
Socio-economic profile
Field of employment, income level and how the audience is distributed across groups.
Behavioural metrics
Down payment, requested and approved loan term, and other characteristics of the deals.
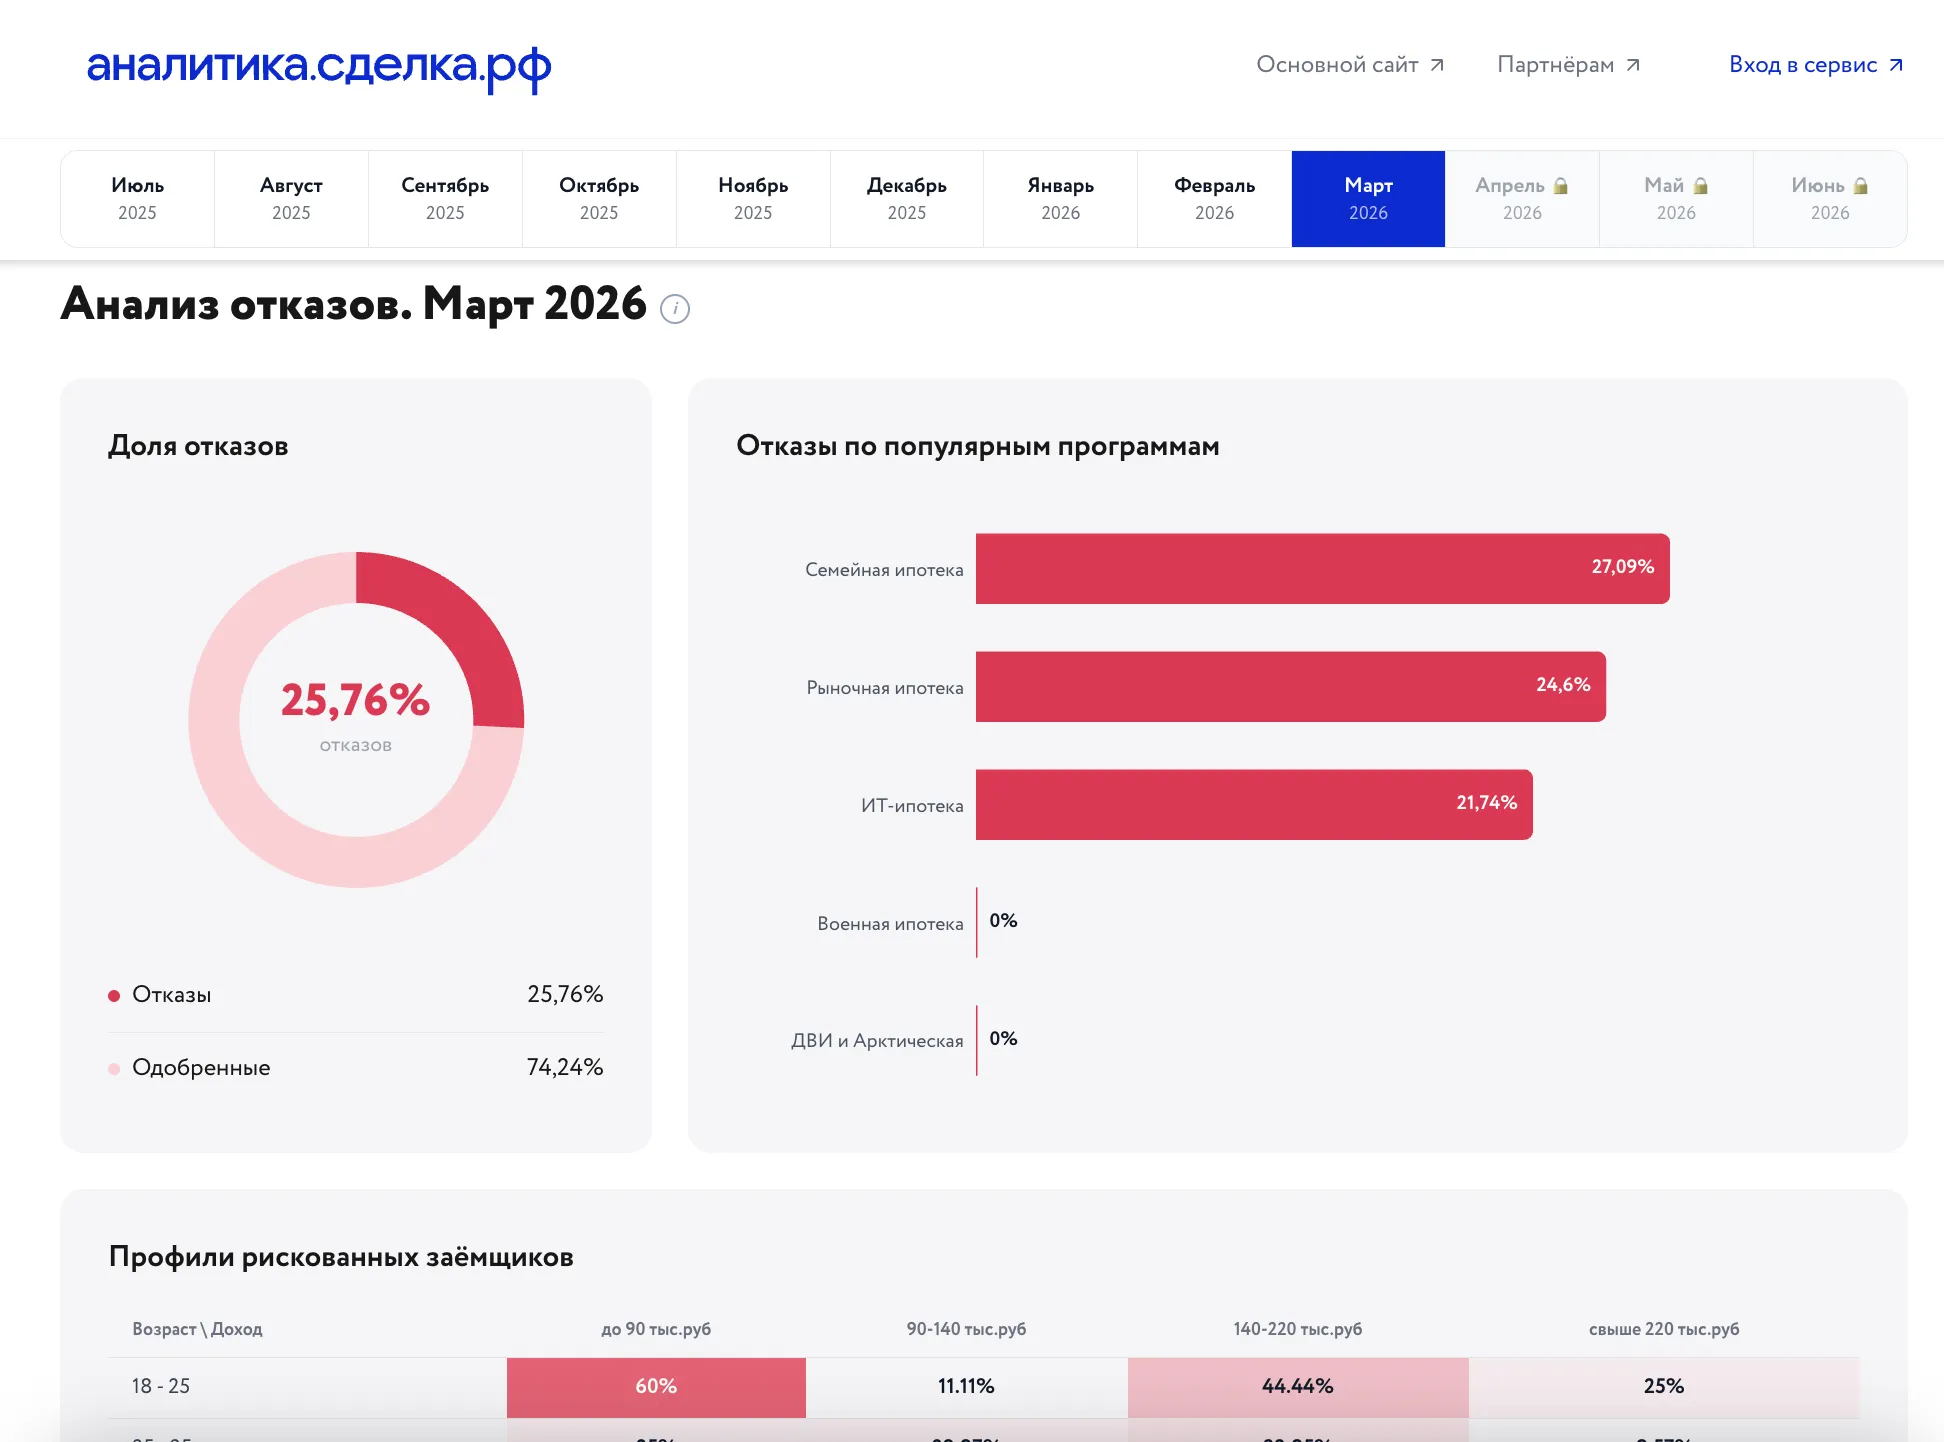
Decline analysis
The share and reasons for declined applications, differences between programmes and combinations of risk factors.
My role
The original idea for the service came from an analyst at Sdelka.rf, and a designer from the marketing team prepared the visual concept. My responsibility was turning that idea and those static mockups into a working public product.
- researched the user journey and comparable analytics services
- refined the product structure and how the analytics sections work together
- adapted the static Figma mockups into an interactive interface
- designed the application architecture and the data workflow
- designed a workable monthly data-update routine for the analyst
- independently built the production application
- made all analytics blocks respond in sync to one shared period selector
- implemented the access restriction for the three most recent months
- added an AI assistant that answers questions based on the service data
- set up request handling and delivery into the team’s working systems
- prepared and carried out the production deployment
- ran scenario testing with Claude Code
- went through a technical review with the CTO and applied the resulting changes
- continue to support and develop the product
My task was not simply to build an interface, but to turn an internal idea into a product that can be updated regularly, published safely and actually used in day-to-day work.
From idea to production
- Research
User journey and comparable products
Studied how executives and specialists work with market data, reviewed similar analytics products and defined the requirements for navigation, periods and interface structure.
- Design
Product and data architecture
Translated the static mockups into a system of interactive blocks and designed a process that lets the analyst refresh the source data every month without reworking the charts by hand.
- 5 days
The first working MVP
Independently built the core application structure, data loading, the period selector and the first analytics blocks.
- 1 June 2026
Public launch
Roughly two weeks after implementation began, the product went public following scenario testing and a technical review by the CTO.
Technology and approach
The technical solution had to support interactive charts, regular data updates, server-side access control and further development of the product. A no-code platform would not have been enough for that.
Interactive application
Next.js and TypeScript handle the application structure, routing, server-side logic and typed work with the data.
Data visualisation
Recharts plus a shared selected-month context keep all seven analytics sections in sync, so figures can be compared inside one interface.
Regular updates
The source data lives in the spreadsheets the analyst already works with. Dedicated parsers convert it into the application’s structure without any manual chart editing.
Access control and AI
The three most recent months are protected server-side and open up once access is confirmed. The AI assistant answers only from the data available to that particular user.
Team and responsibilities
- Sdelka.rf analyst
- The original idea, domain expertise, data preparation and the monthly data update.
- Designer
- The visual concept and interface mockups in Figma.
- Daniil Berdinskikh
- Product research, UX logic, technical design, independent development, launch and ongoing support of the product.
- Marketing Director and CTO
- Project oversight, sign-off on the result, the technical review and security recommendations.
Outcome
An internal idea and a set of static mockups became a working public product that continues to be used and updated.
- the service is in production on its own public domain
- seven types of analytics are brought together in one interface
- nine months of data are open without registration
- the three most recent months act as a partner lead gate
- the data is refreshed monthly through a single process
- an AI assistant helps users work with the analytics
- requests are delivered automatically into the team’s working systems
- twenty-one market indicators are available across the sections
- users no longer have to collect figures from several sources by hand
- Daniil remains responsible for technical support and further development
Gallery
Current status
The product runs in production and is updated every month. I am responsible for technical support and the further development of the service.
The backlog includes broader product analytics, a more capable AI assistant, and tooling that will let companies compare their own figures against the market.